Fsis Recall Data
Welcome to the first posting!
I put in in my head to enact a ‘one-analysis-per-day’ rule, and this is the first result. I ventured over to Data.gov to find some recall information. Source URL. This data is for recall information from the Food Safety and Inspection Service (FSIS).
After converting to CSV and some minor cleaning, I used the following code to convert it into a pandas data frame for some basic exploratory data analysis. This is not in-depth, but more of an attempt to get more practice with pandas data frames. Future analysis will get deeper as I learn and get more comfortable with Python. Comments appreciated in support of the learning process.
Here we go
Data is from 2005 to 2014. As such, this for loop imports all the CSV files I have stored locally. I encountered a utf-8 error and thanks to the folks at Stackoverflow I was able to determine that this encoding would help resolve my issue. Problem solved!
import pandas as pd
import matplotlib.pyplot as plt
from datetime import datetime as dt

%matplotlib inline

def get_data(myvar):
    pth = "/Users/ari/ds/gitblog/FSIS Recall Info/r{}.csv"
    df = []
    for i in myvar:
        fullpath = pth.format(i)
        df.append(pd.read_csv(fullpath, encoding = "ISO-8859-1"))
    return pd.concat(df)

yrs = list(range(2005,2015,1))
rdf = get_data(yrs)
Here we do a bit of additional data cleaning. Data in the ‘recall pounds’ field was not all numeric, so if it was not a number I threw it out. Additionally, we take the provided date format (e.g. Sep 23 2005) and converting to a datetime format.
rdf[pd.to_numeric(rdf['rPounds'], errors='coerce').notnull()].reset_index()
rdf['rDt'] = pd.to_datetime(rdf['rDt'],format='%b %d %Y')
rdf.dropna();
I wanted to do a quick summary by Years and Months, so I added these to the DataFrame object.
rdf['rYr'] = pd.DatetimeIndex(rdf['rDt']).year
rdf['rMo'] = pd.DatetimeIndex(rdf['rDt']).month
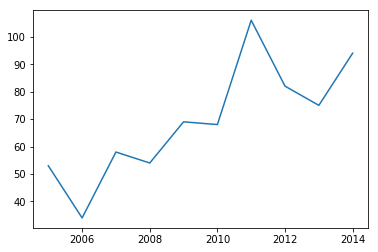
We then plot the Year info.
sDt1 = rdf.rYr.value_counts().sort_index()
sDt1.plot();
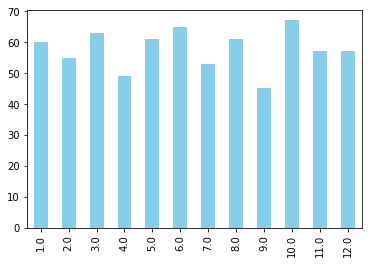
Lastly we plot the Months data as a bar.
sDt2 = rdf.rMo.value_counts().sort_index()
sDt2.plot.bar(color='skyblue');
Stay Chaotic – Stay Neutral